
Stocks 101
As of the latest data, more than 55,000 publicly traded companies are listed on major stock exchanges worldwide, demonstrating the vast scale and diversity of international capital markets. Collectively, these equities represent a market capitalization exceeding $100 trillion USD, underscoring the critical role stock markets play in driving economic growth and capital allocation.
On any given trading day, global exchanges process hundreds of billions of dollars in transaction volume, with leading markets such as the NASDAQ averaging over $570 billion in daily turnover. This exceptional liquidity and efficiency highlight why equity markets remain a cornerstone of global finance.

TradingNetLive Trades
US30 NAS100 SPX500
NAS100, US30, and SPX500 are three major U.S. stock market indices that traders can access through Forex and CFD platforms. USTEC100 (NASDAQ 100) tracks the top 100 tech-driven companies like Apple and Tesla, offering high volatility for active traders. US30 (Dow Jones) represents 30 blue-chip companies across key sectors, serving as a barometer of U.S. economic health. SPX500 (S&P 500) includes 500 of the largest U.S. companies, providing broad market exposure and balanced risk. These indices are highly liquid, influenced by economic data and Federal Reserve policies, and suitable for day trading or long-term strategies.
Why Trade Them?
Trading these indices allows you to diversify across multiple companies in a single position, benefit from high liquidity, and capitalize on market trends without owning individual stocks. They are ideal for traders seeking exposure to the U.S. economy and global market movements.

Stock 101 History
The history of stocks traces its origins to the early 17th century when the Dutch East India Company became the world’s first company to issue publicly traded shares in 1602, allowing investors to pool capital in exchange for equity ownership. This innovative approach to funding spread across Europe, and by 1792, the New York Stock Exchange (NYSE) was formally established when 24 stockbrokers signed the Buttonwood Agreement, creating a central location for buying and selling securities.
Throughout the 19th century, as industrialization, railroads, and new technologies spurred economic growth, stock markets grew in significance, with exchanges such as the Chicago Stock Exchange founded in 1867. The rise of these markets brought more opportunities for capital raising and financial growth, but they also became susceptible to speculation and volatility.
The Great Depression in the 1930s exposed the risks of unregulated markets, prompting the U.S. government to introduce landmark reforms, including the Securities Act of 1933 and the Securities Exchange Act of 1934, which established the Securities and Exchange Commission (SEC) to oversee and regulate market activities.
This regulatory framework ensured transparency, fairness, and protection for investors. In the second half of the 20th century, technological advancements transformed the stock market. In 1971, the NASDAQ was created as the first electronic stock exchange, revolutionizing the trading process by enabling faster and more efficient transactions.
The advent of online trading platforms in the 1990s democratized access to the markets, allowing individual investors to trade stocks from the comfort of their homes.
The rise of algorithmic trading, high-frequency trading (HFT), and quantitative strategies in the 21st century has further advanced market efficiency, but also introduced new challenges related to market manipulation and increased volatility.
Today, stock markets are a complex, high-speed global network of exchanges, providing significant opportunities for wealth creation but also presenting risks that require a deep understanding of market behavior, regulation, and technology.

Trading Global Indices
Learn how major indices like the S&P 500, Dow Jones, FTSE 100, ASX 200, DAX 30 & Nikkei 225 reflect the world’s top economies and sectors. At TradingNetlive, we combine clear education with practical trading tools and expert strategies to help you trade confidently.
Open a regulated account, fund it, and start trading indices buy if you expect a rise, sell if you anticipate a drop. With stop-loss and take-profit tools, you can manage risk while exploring global markets. Whether you’re a beginner or looking to diversify, TradingNetLive gives you the knowledge, insights, and support to succeed.
_edited.jpg)
Today, it represents a trillion-dollar market capitalization and sees hundreds of millions of shares traded daily. In Forex and CFD markets, traders can access the US30 as a single instrument, allowing them to buy (long) if they expect the index to rise or sell (short) if they anticipate a decline, making it a key tool for both investors and traders seeking exposure to the U.S. economy in one consolidated index.
Dow Jones Industrial Average - DJIA
The Dow Jones Industrial Average (US30) is one of the oldest and most respected stock indices in the world, first published on May 26, 1896, with just 12 industrial companies and a starting value of 40.94 points. It expanded to 30 major U.S. blue-chip firms in 1928, evolving to reflect the broader U.S. economy and including sectors such as technology, healthcare, finance, and consumer goods. Over the decades, the DJIA has marked significant milestones: surpassing 1,000 points in 1972, 10,000 points in 1999, and 20,000 points in 2017, while enduring major market events like the Great Depression, Black Monday (1987), the 2008 financial crisis, and the COVID-19 pandemic.

The Standard & Poor's 500 - S&P 500
The S&P 500 is a benchmark index representing 500 of the largest publicly traded U.S. companies, covering all 11 sectors of the economy and offering a comprehensive view of the U.S. stock market. Introduced in 1957, it has become the go-to index for investors seeking broad market exposure. Weighted by market capitalization, larger companies like Apple, Microsoft, and Amazon have a greater influence on its movements, with the top 10 companies often making up 30–35% of the index.
.jpg)
The S&P 500 represents a total market capitalization of approximately $45–50 trillion, with an average daily trading volume in the billions of shares, and a historical average annualized return of ~10–11%. Dividend-paying companies in the index offer an additional yield of roughly 1.5–2%, making it a popular choice for long-term investors. Globally, it serves as a benchmark for mutual funds, ETFs, and institutional portfolios, while in Forex and CFD markets, traders can buy (long) if they expect the index to rise or sell (short) if they anticipate a decline, providing versatile trading opportunities and exposure to the U.S. economy.

National Association of Securities Dealers Automated Quotations - NASDAQ
The NASDAQ 100 (USTEC100/NAS100) tracks the top 100 non-financial companies listed on the NASDAQ stock exchange, with a heavy focus on technology, consumer services, and biotech sectors. Launched in 1985, it has become a leading barometer for tech-driven growth and innovation in the U.S. economy. Major companies such as Apple, Microsoft, Tesla, Amazon, and Nvidia dominate its composition, and the top 10 companies can account for over 50% of the index’s weight, highlighting its concentration in high-cap tech stocks. The NASDAQ 100 represents a market capitalization of over $20 trillion, and its derivatives and ETFs see average daily trading volumes in the hundreds of millions of shares/contracts, providing strong liquidity for traders.

Historically, the index has delivered average annualized returns of around 12–14%, reflecting the tech sector’s growth potential, though it can also be more volatile than broader indices like the S&P 500. Traders can access the NASDAQ 100 via Forex, CFDs, or ETFs to buy (long) if they expect gains or sell (short) if they anticipate declines, offering opportunities for both speculative and strategic investment.

Russell 2000
The Russell 2000 Index (RUT) is the leading U.S. small-cap stock market benchmark, tracking approximately 2,000 of the smallest publicly traded companies within the broader Russell 3000. First launched in 1984 by the Frank Russell Company and now maintained by FTSE Russell, a subsidiary of the London Stock Exchange Group, the index is widely regarded as a barometer for U.S. small-cap equity performance and domestic economic sentiment. Its constituents trade primarily on the NYSE, Nasdaq, and OTC Markets, and the index is float-adjusted and market capitalization–weighted, representing about 7% of the total Russell 3000 market cap.
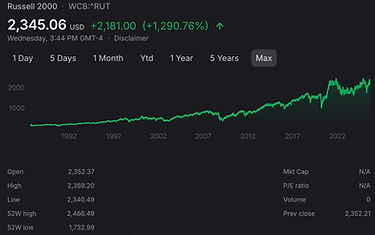
As of late 2024, the Russell 2000 had a $3.65B average market cap, with a median of $990M and its largest member at $14.7B. Trading is highly liquid, averaging 3.9B shares daily, with exposure available through ETFs like IWM and VTWO, plus futures and mutual funds. Known for its higher volatility and growth potential versus large-cap indexes, it is sensitive to interest rates and U.S. economic cycles, making it both a key market indicator and a prime vehicle for traders seeking 5–15% swings.
Russell 3000

The Russell 3000 Index is one of the broadest benchmarks of the U.S. equity market, tracking approximately 3,000 large-, mid-, and small-cap companies and covering about 98% of the investable U.S. stock market. As of April 30, 2025, the index had a total market capitalization of roughly $58.4 trillion, with an average market cap of $966 million and a median market cap of $2.28 billion.
Reconstituted annually by FTSE Russell, a subsidiary of the London Stock Exchange Group (LSEG), the index recorded over $220 billion in trading volume during its June 2025 rebalance across the NYSE and Nasdaq closing auctions. Widely regarded as a comprehensive measure of U.S. market performance, the Russell 3000 is accessible through ETFs such as the iShares Russell 3000 (IWV), mutual funds, and futures contracts. With broad exposure across all sectors and market caps, it serves as both a benchmark for investors and a reliable indicator of overall U.S. equity market health.

FTSE 100
The FTSE 100 Index (Financial Times Stock Exchange 100) is the United Kingdom’s premier stock market benchmark, tracking the 100 largest companies listed on the London Stock Exchange (LSE) by market capitalization. Introduced in 1984, it is widely recognized as the key benchmark for the UK’s blue-chip equity market, featuring leading multinational companies such as HSBC, Unilever, BP, and AstraZeneca.


Launched on January 3, 1984, at an initial value of 1,000 points, the FTSE 100 now has a total market capitalization of approximately £2.9 trillion (2025) and an average daily trading volume of around 200 million shares. Investors can access the FTSE 100 via ETFs, futures, options, and mutual funds, providing broad exposure to the UK’s largest and most liquid companies.
DAX 40
The DAX 40 Index is Germany’s premier stock market benchmark, tracking the 40 largest and most liquid companies listed on the Frankfurt Stock Exchange by market capitalization and order book volume.
Launched on July 1, 1988, with an initial value of 1,163.52 points, the index has grown to a total market capitalization of approximately €1.891 trillion as of March 2025, with an average daily trading volume of around 54 million shares.
It covers a diverse range of sectors including automotive, finance, chemicals, technology, and consumer goods, featuring multinational companies such as Siemens, Volkswagen, Bayer, SAP, and Adidas. Market-cap weighted, larger companies exert a greater influence on its performance.
The DAX 40 reached an all-time intraday high of 23,543 points in May 2025, underscoring its prominence as a key indicator of German and global equity markets. Investors can gain exposure through ETFs, futures, options, and mutual funds, making it a vital tool for both domestic and international traders.


CAC 40
The CAC 40 index is the leading principal benchmark for the French stock market, established in 1987 with a base value of 1,000. It signifies the overall strength and trajectory of the French economy by tracking the top 40 publicly listed companies on Euronext Paris.

On average, the CAC 40 returned 6.1% annually over three decades; it outperformed the UK’s FTSE 100 (5.8%) but lagged the US S&P 500 (8.2%).
The index's composition features a rich blend of sectors including finance, industrials, energy, healthcare, luxury goods, technology, telecommunications, and consumer staples.
Some of the most prominent companies currently in the CAC 40 include Hermès International ($287B market cap), LVMH Moët Hennessy – Louis Vuitton ($286B), L'Oréal ($235B), Airbus ($164B), Schneider Electric, TotalEnergies, Sanofi, AXA, BNP Paribas, and Vinci SA.
In 2007, Euronext merged with the New York Stock Exchange (NYSE) to form NYSE Euronext, marking the creation of the world’s first transatlantic stock and derivatives exchange. This landmark merger broadened the global appeal and visibility of the CAC 40, connecting France’s premier index more deeply with international markets and investors.

EURO STOXX 50
The EURO STOXX 50 is the main blue-chip stock index for the Eurozone, launched in 1998 to represent 50 of the largest and most actively traded companies from 11 European countries.
Its members include major firms such as ASML Holding, SAP, Siemens, Allianz, LVMH, Schneider Electric, Santander, TotalEnergies, Deutsche Telekom, and Airbus.
The index is weighted by free-float market capitalization—capped at 10% per member for diversification—and is recalculated quarterly, ensuring up-to-date representation of the region’s top sector leaders.
As of September 2025, its value is about 5,362 points, with a year-to-date gain near 10% and €25 billion linked to ETFs and derivatives that track it globally.


NIKKEI 225
The Nikkei Stock Average, commonly called the Nikkei 225, is Japan's premier stock market index, tracking the performance of 225 highly traded companies across a wide range of sectors.
Launched in 1950, it covers the Tokyo Stock Exchange and includes iconic global leaders like Toyota Motor Corporation, Sony Group, Hitachi, SoftBank Group, Fast Retailing, Mitsubishi UFJ Financial Group, and Honda Motor.
As of September 2025, the Nikkei 225 stands at 43,644 points and features top firms not only in automotive and electronics but also in finance, retail, telecommunications, pharmaceuticals, and industrials.
The index plays a crucial role as an international benchmark for the Japanese economy and remains widely followed by investors worldwide.

The Nikkei 225's market capitalization was about ¥790.94 trillion (roughly $5.4 trillion USD) in September 2025, representing over 73% of Japan’s total stock market value.
Japan's overall market capitalization reached $6,358 billion in February 2025, making it one of the largest equity markets globally.
Major companies like Toyota, Sony, and Mitsubishi have individual market caps ranging from $50 billion to over $250 billion, helping the Nikkei 225 exert a huge influence on both domestic and international financial markets

Shanghai Composite
The Shanghai Composite Index (SSE Composite) is the central benchmark for China’s stock market, tracking all A-shares and B-shares—over 1,500 companies listed at the Shanghai Stock Exchange, spanning vital sectors like finance, technology, energy, consumer goods, and healthcare.
As of September 2025, major constituents include Kweichow Moutai, Industrial & Commercial Bank of China, Agricultural Bank of China, Ping An Insurance, China Life, and PetroChina.

The market capitalization of the index surpassed $6 trillion USD—making Shanghai the world’s third largest exchange—and China’s combined stock market capitalization (including Shanghai and Shenzhen) is close to $12 trillion USD in 2025.
The index also demonstrates strong liquidity, with daily trading volumes routinely exceeding 66 billion shares.
The origins of stock trading in Shanghai date back to June 1866, when a list of thirteen companies, including the Hong Kong & Shanghai Banking Corporation, was published, marking the beginning of a regular system of dealing in shares. In 1891, this evolved into the formal Shanghai Sharebrokers Association, which later became the Shanghai Stock Exchange in 1904.
The market operated continuously until December 8, 1941, when trading halted due to World War II. After several decades, the Shanghai Stock Exchange was officially re-established on November 26, 1990, resuming operations on December 19, 1990, and has since grown into one of the world’s largest stock exchanges.


KOSPI

The KOSPI index represents the entire Korean stock market, tracking all common stocks listed on the Korea Exchange (KRX) Main Board.
The KOSPI 200 is a subset index consisting of the 200 largest and most liquid stocks on the KOSPI, covering around 70% of the total market capitalization
The KOSPI (Korea Composite Stock Price Index) is South Korea’s primary stock market index, tracking all common stocks listed on the Korea Exchange's main board.
Established in 1983 with a base value of 100 points, KOSPI functions as a market capitalization-weighted index, reflecting the overall health of South Korea’s equity market.
Major companies in the index include Samsung Electronics, SK Hynix, Hyundai Motor, Samsung Biologics, and LG Energy Solution.
The index reached an all-time high of 3,305 points in July 2021 and remains a key benchmark for investors tracking South Korea's economic performance.

ASX 200
The S&P/ASX 200 (ASX 200) is Australia’s leading stock market index, launched on 3 April 2000. It tracks the performance of the 200 largest companies listed on the Australian Securities Exchange by float-adjusted market capitalization, covering around 79% of the total Australian equity market.
As of mid-2025, the index represents a market value in the trillions of Australian dollars, with its composition dominated by the financials and materials sectors.
The ASX 200 is rebalanced quarterly to reflect changes in company size and liquidity, and it serves as the benchmark index for institutional investors while underpinning major Australian exchange-traded funds (ETFs).
As of September 2025, the index is trading near 8,850 points, delivering an approximate 11% one-year return, and over the long term it has produced an annualized return of about 8.4% including dividends.


NIFTY 50
The Nifty 50 is a prominent Indian stock market index representing the float-weighted average of the 50 largest and most liquid companies listed on the National Stock Exchange (NSE).
Launched on April 22, 1996, with a base value of 1,000 (referencing November 3, 1995), the index covers 13 key sectors including financial services, information technology, oil and gas, consumer goods, and automotive.
As of early 2025, financial services hold the largest weight (~33%), followed by IT (~14%) and oil & gas (~12%). Major companies in the index include Reliance Industries, HDFC Bank, Tata Consultancy Services, Bharti Airtel, and Infosys.
The Nifty 50 is widely used for benchmarking portfolios, launching index funds, ETFs, and futures and options trading. It is rebalanced semi-annually, with strict liquidity and listing history criteria for inclusion.

Total Stock Market Index Fund

The main and largest Total Stock Market Index Fund ETF is the Vanguard Total Stock Market ETF (VTI). VTI seeks to track the performance of the CRSP US Total Market Index, providing broad exposure to nearly all publicly traded U.S. stocks across large-, mid-, small-, and micro-cap sectors. Launched in 2001, it holds over 3,600 stocks and has a market capitalization of approximately $665 billion as of 2025.
VTI is widely favored due to its low expense ratio of 0.03%, strong liquidity, and diversified portfolio, making it a convenient way for investors to access the full U.S. equity market in a single investment. It pays dividends quarterly with a dividend yield near 1.2% and allows trading throughout the day like any other stock.
The Vanguard Total Stock Market ETF (VTI) is the main and largest total stock market index fund ETF, tracking the CRSP US Total Market Index, representing nearly all U.S. publicly traded companies across large, mid, small, and micro-cap stocks. Launched in 2001, it holds over 3,600 stocks with a market capitalization around $665 billion in 2025. With a low expense ratio of 0.03% and strong liquidity, VTI offers broad diversification and pays quarterly dividends with a yield near 1.2%, making it a popular choice for exposure to the entire U.S. equity market through a single fund.
How The Stock Market Works
The Federal Reserve props up the stock market mainly through its control of the money supply and interest rates. When the Fed eases policy—by lowering rates or expanding M1 and M2 through programs like quantitative easing—it injects liquidity into the financial system.
A large part of this flows into U.S. Treasury bonds, especially the 10-year, where Fed buying pushes yields lower. Falling yields make bonds less attractive compared to equities, encouraging investors to move into risk assets such as stocks.
At the same time, lower yields reduce the discount rate used to value future corporate earnings, which lifts stock valuations. The increased money supply and lower rates also tend to weaken the U.S. dollar, helping multinational companies earn more from foreign revenues.
Together, these forces channel liquidity from the Fed, through Treasuries and the bond market, into equities, supporting higher stock prices.
The stock market functions as a network of exchanges where investors buy and sell ownership shares in publicly traded companies. Companies list shares on stock exchanges through an initial public offering (IPO) to raise capital that fuels their growth. Once listed, investors trade these shares among themselves on the secondary market.
Buying Indexes
An index (like the S&P 500, NASDAQ 100, ASX 200, or FTSE 100) is not a stock you can buy directly. Instead, it’s a basket of stocks that tracks the performance of a segment of the market.
For example, the S&P 500 measures the performance of the 500 largest U.S. companies listed on the NYSE and NASDAQ. An index is basically just a number that represents how a group of stocks is performing—it isn’t a company, a share, or a product.
Since you can’t buy an index itself, investors use products that replicate it, such as ETFs (Exchange-Traded Funds). For instance, the ETF SPY is designed to copy the performance of the S&P 500. This way, when the index goes up or down, the ETF generally moves in the same direction.
That’s why you can’t go onto the stock market and “buy” the S&P 500 directly you buy an ETF or fund that tracks it.
Anti-Inflationary Asset
Stocks can help protect your money from inflation because they represent ownership in companies that can raise prices when costs go up. When inflation pushes prices higher, many companies can pass those costs to customers, keeping their profits intact.
Over time, this means the value of the stock and any dividends you earn can grow faster than inflation, helping your money maintain its buying power. While stocks can go up and down in the short term, they have historically outpaced inflation over the long run, making them a good way to keep your wealth from losing value.
Largest Stock Exchanges

New York Stock Exchange (NYSE) – United States
The New York Stock Exchange (NYSE), located in the United States, is the world’s largest stock exchange by market capitalization, valued at around $28 trillion.

London Stock Exchange (LSE) – United Kingdom
The London Stock Exchange (LSE) is home to many multinational companies and major financial institutions. With a market capitalization of around $4.6 trillion and over 2,000 listed companies, it serves as a key hub for global finance, connecting investors and businesses worldwide and facilitating the trading of a wide range of securities.

Cboe Global Markets (CBOE) – United States
Cboe Global Markets (CBOE), based in the U.S., is primarily known for options and derivatives trading. In 2025, it averaged about 14 million contracts traded daily, with record single-day volumes exceeding 5 million S&P 500 options contracts, making it a key hub for derivatives markets.
Types Of Stocks
Growth Stocks
–
These are shares in companies expected to grow faster than the overall market, often reinvesting profits instead of paying dividends. They can offer high returns over time but are usually more volatile. Example: Technology companies like Apple or Tesla.
Dividend (Income) Stocks
–
These stocks pay regular dividends to shareholders, providing a steady income stream. They tend to be less volatile than growth stocks and are popular among retirees or income-focused investors. Example: Utility companies or blue-chip firms like Coca-Cola.
Value Stocks
–
These are shares of companies trading below their perceived worth, based on metrics like earnings or assets. Investors buy them expecting the stock price to rise when the market recognizes their true value. Example: Established industrial or financial companies that may be temporarily undervalued.
Blue-Chip Stocks
–
Large, well-established companies with a strong track record, often paying dividends and considered safer investments. Example: Microsoft, Johnson & Johnson.
Small-Cap and Mid-Cap Stocks
–
Smaller companies that can grow quickly but are often more volatile and risky than large-cap stocks.
Types Of Investment Funds
Exchange-Traded Funds (ETFs)
Exchange-Traded Funds (ETFs) are investment funds that let you buy a slice of many stocks or other assets at once, giving instant diversification with a single purchase. Unlike mutual funds, which are priced only once per day, ETFs trade like a stock on an exchange, so their price changes throughout the trading day based on supply and demand.
ETFs often follow a specific index, such as the S&P 500, NASDAQ 100, or ASX 200, so by buying one ETF, you can invest in all the companies in that index. They are popular with beginners because they are easy to buy and sell, have relatively low fees, and can be traded in high volumes, making it simple to enter or exit positions at market prices.
Mutual Funds
Mutual funds let you pool your money with other investors to buy a mix of stocks, bonds, or other investments. A professional manager chooses what to buy and sell, so you don’t have to. They’re popular because even a small amount of money can be spread across many companies, giving instant diversification and making investing easier for beginners.
Some of the most popular and well-regarded mutual funds include Vanguard Total Stock Market Index Fund (VTSAX), which gives broad exposure to the entire U.S. stock market, and Vanguard 500 Index Fund Admiral Shares (VFIAX), which tracks the S&P 500. Other low-cost options are Fidelity 500 Index Fund (FXAIX), Schwab S&P 500 Index Fund (SWPPX), and Fidelity ZERO Total Market Index Fund (FZROX), all of which provide diversified exposure with minimal fees.
For investors seeking dividend-focused growth, Vanguard Dividend Growth Fund (VADGX) is popular, while the actively managed Fidelity Contrafund (FCNTX) focuses on long-term growth stocks.
Index Funds
Index funds are a type of mutual fund or ETF that copies a specific market index, like the S&P 500 or ASX 200. Instead of trying to beat the market, they aim to match its performance, which makes them low-cost and easy to manage. They are a popular choice for beginners because you can invest in many companies at once without having to pick individual stocks.
Some popular mutual funds and index funds include Vanguard Total Stock Market Index Fund (VTSAX), Vanguard 500 Index Fund Admiral Shares (VFIAX), Fidelity 500 Index Fund (FXAIX), Schwab S&P 500 Index Fund (SWPPX), and Fidelity ZERO Total Market Index Fund (FZROX), which offer broad market exposure. For investors seeking dividend income, Vanguard Dividend Growth Fund (VADGX) is a common choice, while the actively managed Fidelity Contrafund (FCNTX) focuses on long-term growth stocks. Mid-sized company exposure can be gained through Vanguard Mid-Cap Index Fund (VIMAX), providing a diversified mix for different investment goals.
Stock Brokers
Stock brokers are professionals or companies that help you buy and sell stocks, ETFs, mutual funds, and other investments. When you want to invest in the stock market, you typically need a broker because you cannot trade directly on most exchanges as an individual.
Brokers provide a platform or account where you can place orders, view market data, and track your investments. Some brokers are full-service, offering research, advice, and portfolio management, while discount brokers focus on low-cost trades with fewer extra services.
Popular examples include Fidelity, Charles Schwab, E*TRADE, WeBull, or Robinhood, Using a broker makes investing easier, safer, and more efficient, whether you are buying a single stock or managing a diversified portfolio.
Economic Indicators
-
GDP (Gross Domestic Product) – overall economic growth
-
Interest Rates – borrowing costs set by central banks
-
PPI (Producer Price Index) – tracks wholesale inflation
-
Unemployment Rate – labor market health
-
CCI (Consumer Confidence Index) – consumer sentiment
-
Retail Sales – consumer spending trends
-
Manufacturing & Services PMI – sector growth and activity
-
Inflation (CPI or general price levels) – cost of living and purchasing power
Economic indicators like GDP, interest rates, and inflation play a big role in the stock market. GDP shows how fast the economy is growing; strong growth usually boosts corporate profits and stock prices.
Interest rates, set by central banks, affect borrowing costs for companies and consumers—lower rates make it cheaper to borrow and often support higher stock prices, while higher rates can slow growth.
Inflation measures how quickly prices are rising; moderate inflation can signal a healthy economy, but high inflation can hurt profits and reduce stock market returns.
Investors watch these indicators closely because they influence corporate earnings, investor sentiment, and the overall flow of money into stocks.

Options & Derivatives
Derivatives are financial contracts whose value comes from an underlying asset, such as a stock, bond, commodity, or index. They are not the asset itself but a way to speculate on or hedge against price movements.
Options are a common type of derivative. They give you the right, but not the obligation, to buy or sell an asset at a set price before a specific date.
-
Call options let you buy the asset at a set price.
-
Put options let you sell the asset at a set price.
Investors use options and other derivatives for hedging risks (protecting against losses), speculating on price movements, or enhancing portfolio returns. While they can be powerful tools, they are complex and carry higher risk than simply buying stocks.
Derivative Markets
The derivatives market is the world’s largest financial market, with a notional value estimated around $729 trillion. This number doesn’t represent actual money changing hands, but rather the total value of the underlying assets covered by derivative contracts.
Derivatives are contracts whose value depends on an underlying asset, such as stocks, bonds, commodities, interest rates, or currencies.
They include instruments like options, futures, swaps, and forwards, and are used for hedging risk, speculating on price movements, or managing exposure. Because one derivative can cover a large underlying position, the notional value becomes enormous, far exceeding the actual size of the global economy.
While derivatives can be powerful tools for managing risk, they can also be highly complex and risky, which is why they are mostly used by professional investors and institutions.
The stock market facts and statistics provided by TradingNetLive are for educational and informational purposes only. Figures, data, and examples are subject to change and may not reflect the most current market conditions. This content does not constitute financial advice and should not be relied upon when making investment decisions.
Users are encouraged to independently verify information and consult a qualified financial professional before trading or investing. Past performance and illustrative examples do not guarantee future results